| HiFYQ | Cormorant detection – island system | WAT – cormorant | WAT – otter |
HiFYQ
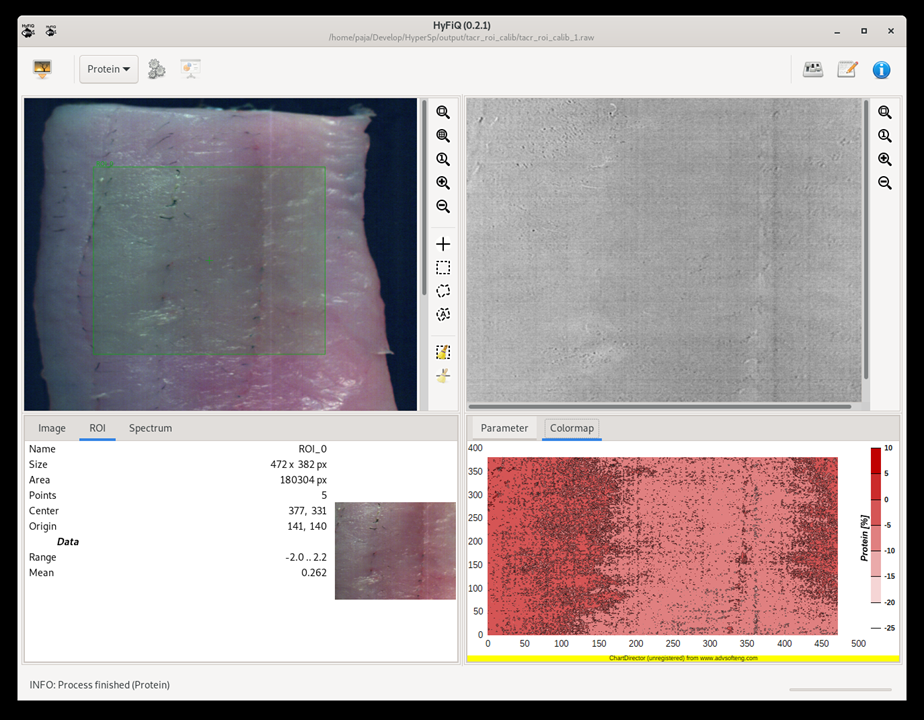
Software for estimating fillet parameters from data from the HiFYQ hyperspectral camera. HiFYQ software, which is used for automatic processing of data from hyperspectral scanning. The software allows reading of scanned data, detection of the fillet area and subsequent prediction of parameters using the created model. The user only has to provide the input data and the subsequent analysis is performed automatically. The software allows you to view input data, spectra and export data to a format usable for Microsoft Excel. The software is a stand-alone program with a graphical user interface that allows you to load an image from a hyperspectral camera and process it automatically. The processing result is displayed using a clear visualization and can be exported for further processing. The software is thus ready for deployment in a real process, where an image from a hyperspectral camera will be used as input for parameter estimation.
Software + testing data + manual
Cormorant detection – island system
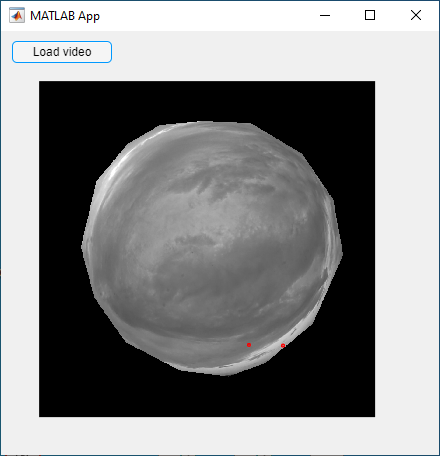
Cormorant data analysis software: the software was implemented in the Matlab package and was exported as an executable file for the Microsoft Windows platform. The software is used to process video recordings from a camera located on a pond. The user uploads a video file from the camera using the user interface. It manually marks the background that masks the pond level, and the software then automatically detects birds flying over the pond. The output is an Excel file with the time and number of detected birds in the video. The software is transferred to the RIV as a type R result. The software could not be implemented as a web service due to the computational complexity and inefficiency of the transmission of large videos over the Internet.
Software + testing data + manual
WAT – cormorant
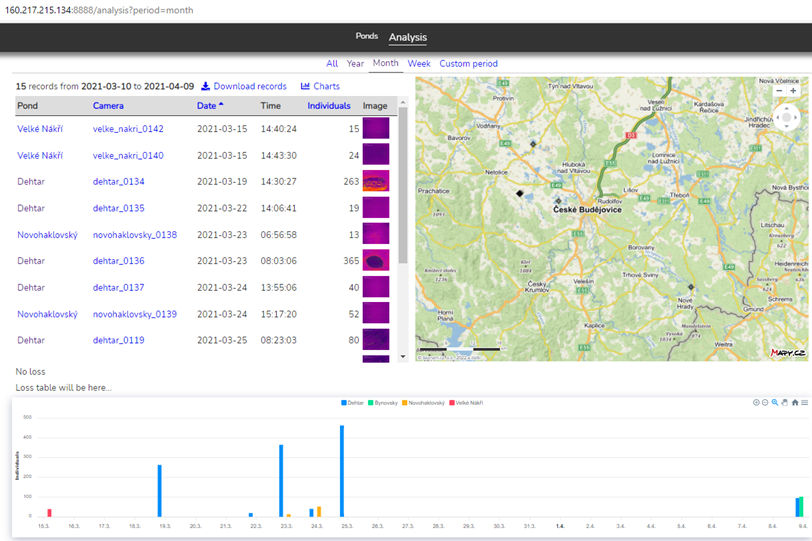
Cormorant count software: the software has been implemented as a web service so that it is accessible to all users. The software runs on a server that was purchased as part of the project. The user first creates a user account. He then defines the ponds on the map where he carries out monitoring. It is possible to define a crew for each pond, on the basis of which the losses caused by otters are then estimated. After each monitoring using a drone and thermal camera, it uploads all the images using the upload button. The software assigns the image to the pond according to the GPS coordinates in the image and detects cormorants. The result of the detection is saved as an image with marked cormorants to the appropriate pond for inspection. This way, the user uploads photos for all monitoring days. In the analysis menu, the user then selects the ponds he wants to analyze. It also selects a time period for analysis and the software creates an overview of the number of cormorants for each pond separately and plots it in a graph. The data can then be exported in the form of an image or Excel spreadsheet. In this way it is possible to perform analysis for any ponds.
Software: http://wat.frov.jcu.cz/
WAT – otter
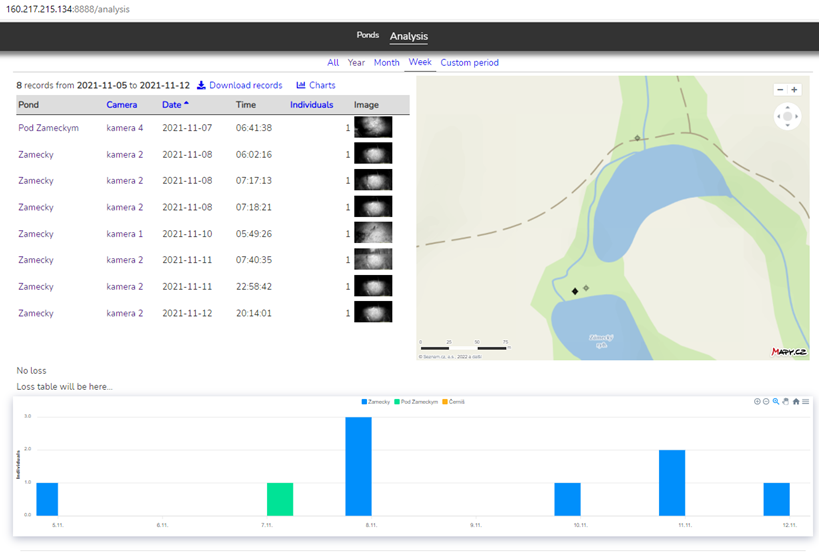
Otter data analysis software: the software has been implemented as a web service so that it is accessible to all users. The software runs on a server that was purchased as part of the project. The user first creates a user account. He then defines the ponds on the map where he carries out monitoring. It is possible to define a crew for each pond, on the basis of which the losses caused by otters are then estimated. The user defines the camera (s) for each monitored pond. It is then possible to upload video recordings taken with each trap to each camera. After uploading the data, the software detects the otter in the video. For videos where an otter has been detected, a reference image is stored to check that the detection is working properly and the information is stored for the relevant pond. In this way, the user uploads videos for all monitored areas. The user then selects the ponds he wants to analyze. It is possible to use all or only selected cameras. It also selects a time period for analysis and the software creates an overview of the occurrence of otters for each pond separately and plots it in a graph. The data can then be exported in the form of an image or Excel spreadsheet. In this way, it is possible to perform analysis for any ponds where photo traps have been installed.
Software: http://wat.frov.jcu.cz/